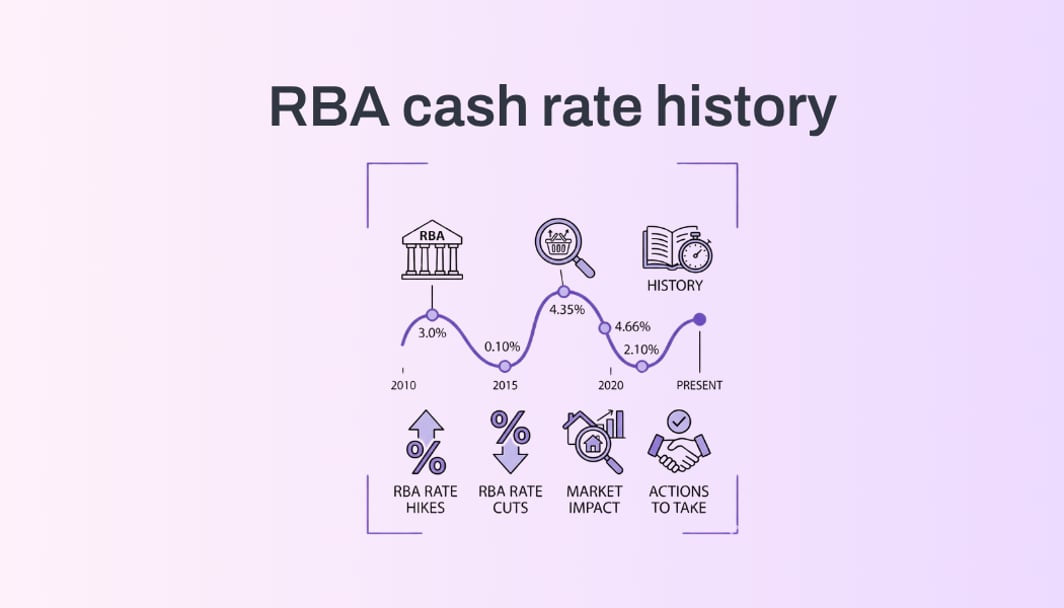
The RBA has set Australia's cash rate since 1990, moving it through booms, recessions, a global financial crisis, a pandemic, and a historic inflation surge. This page shows every RBA cash rate decision, the date, the rate, the change, and the story behind it. Currently at 4.10% as of March 2026.
What are the major RBA cash rate cycles since 1990?
The RBA has moved through five distinct rate cycles since 1990:
1990s Disinflation (17.50% → 4.75%): The RBA spent the 1990s aggressively cutting rates after the early-1990s recession tamed runaway inflation. This era established the modern 2–3% inflation target framework.
2002–2008 Tightening (4.25% → 7.25%): A long economic expansion driven by the mining boom and strong consumer spending pushed rates steadily higher. The 2008 peak of 7.25% was the highest rate in the post-1990 era.
GFC Emergency Cuts (7.25% → 3.00% in 7 months): The fastest cutting cycle in RBA history, responding to the global financial crisis. Australia avoided recession, partly due to aggressive rate cuts and fiscal stimulus.
Post-GFC Easing and Record Low Era (2012–2021): A decade-long drift toward ultra-low rates, culminating in 0.10% during COVID. This era saw mortgage rates fall below 2% and supercharged the property market.
2022–2026 Inflation Cycle (0.10% → 4.35% → 3.60% → 4.10%): The most volatile period since the 1990s. Rates rose 4.25 percentage points in 18 months, then fell 0.75 points across 2025, before rising again in early 2026 as inflation proved stickier than expected.
Historical RBA Decisions
| Date | Rate | Change |
|---|---|---|
| 17 Mar 2026 | 4.10% | +0.25% |
| 4 Feb 2026 | 3.85% | +0.25% |
| 30 Jan 2026 | 3.60% | Hold |
| Year | Start | End | Net Change | Hikes | Cuts |
|---|---|---|---|---|---|
| 2025 | 4.35% | 3.60% | -0.75% | - | 3 |
| 2024 | 4.35% | 4.35% | - | - | - |
| 2023 | 3.10% | 4.35% | +1.25% | 5 | - |
| 2022 | 0.10% | 3.10% | +3.00% | 8 | - |
| 2021 | 0.10% | 0.10% | - | - | - |
| 2020 | 0.75% | 0.10% | -0.65% | - | 2 |
| 2019 | 1.50% | 0.75% | -0.75% | - | 3 |
| 2018 | 1.50% | 1.50% | - | - | - |
| 2017 | 1.50% | 1.50% | - | - | - |
| 2016 | 2.00% | 1.50% | -0.50% | - | 2 |
| 2015 | 2.50% | 2.00% | -0.50% | - | 2 |
| 2014 | 2.50% | 2.50% | - | - | - |
| 2013 | 3.00% | 2.50% | -0.50% | - | 2 |
| 2012 | 4.25% | 3.00% | -1.25% | - | 4 |
| 2011 | 4.75% | 4.25% | -0.50% | - | 2 |
| 2010 | 3.75% | 4.75% | +1.00% | 4 | - |
| 2009 | 4.25% | 3.75% | -0.50% | 3 | 2 |
| 2008 | 6.75% | 4.25% | -2.50% | 2 | 4 |
| 2007 | 6.25% | 6.75% | +0.50% | 2 | - |
| 2006 | 5.50% | 6.25% | +0.75% | 3 | - |
| 2005 | 5.25% | 5.50% | +0.25% | 1 | - |
| 2004 | 5.25% | 5.25% | - | - | - |
| 2003 | 4.75% | 5.25% | +0.50% | 2 | - |
| 2002 | 4.25% | 4.75% | +0.50% | 2 | - |
| 2001 | 6.25% | 4.25% | -2.00% | - | 6 |
| 2000 | 5.00% | 6.25% | +1.25% | 4 | - |
| 1999 | 4.75% | 5.00% | +0.25% | 1 | - |
| 1998 | 5.00% | 4.75% | -0.25% | - | 1 |
| 1997 | 6.00% | 5.00% | -1.00% | - | 2 |
| 1996 | 7.50% | 6.00% | -1.50% | - | 3 |
| 1995 | 7.50% | 7.50% | - | - | - |
| 1994 | 4.75% | 7.50% | +2.75% | 3 | - |
| 1993 | 5.75% | 4.75% | -1.00% | - | 2 |
| 1992 | 7.50% | 5.75% | -1.75% | - | 3 |
| 1991 | 12.00% | 8.50% | -3.50% | - | 4 |
| 1990 | 17.25% | 12.00% | -5.25% | - | 5 |
Frequently Asked Questions
In March 2016, the RBA cash rate was 2.00%. The RBA cut it to 1.75% in May 2016 and to 1.50% in August 2016, where it stayed for over three years.
Explore RBA Cash Rate
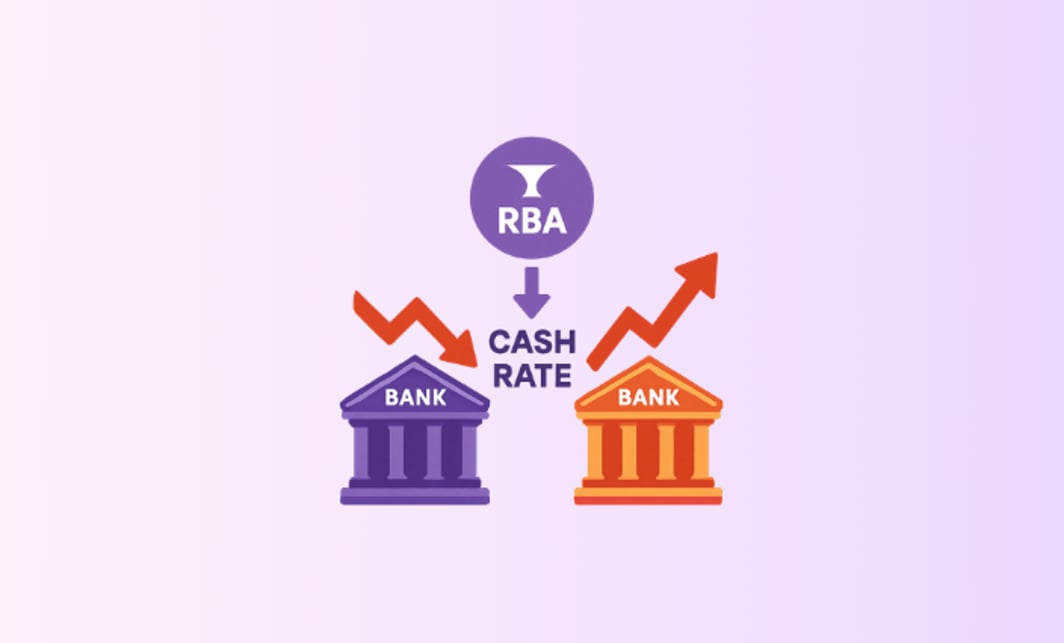
How the Cash Rate Works
Learn how the RBA sets the cash rate and how it flows through to your mortgage.
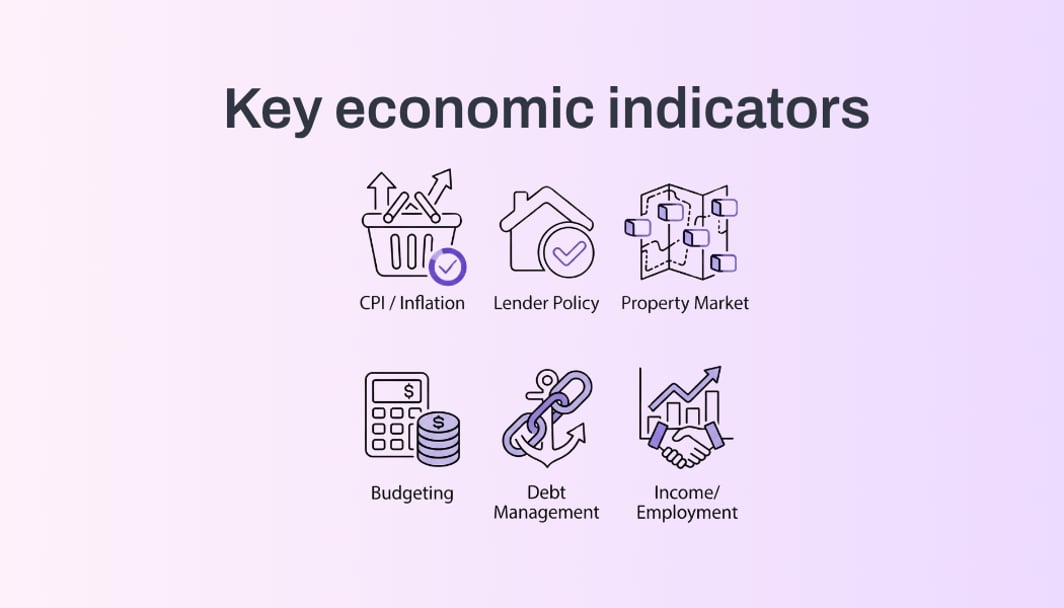
Economic Indicators
Explore the key economic data the RBA monitors when making rate decisions.
Bank Responses
See how major lenders respond to RBA rate changes and compare their pass-through rates.
Impact Calculator
Calculate how rate changes affect your monthly repayments and borrowing capacity.