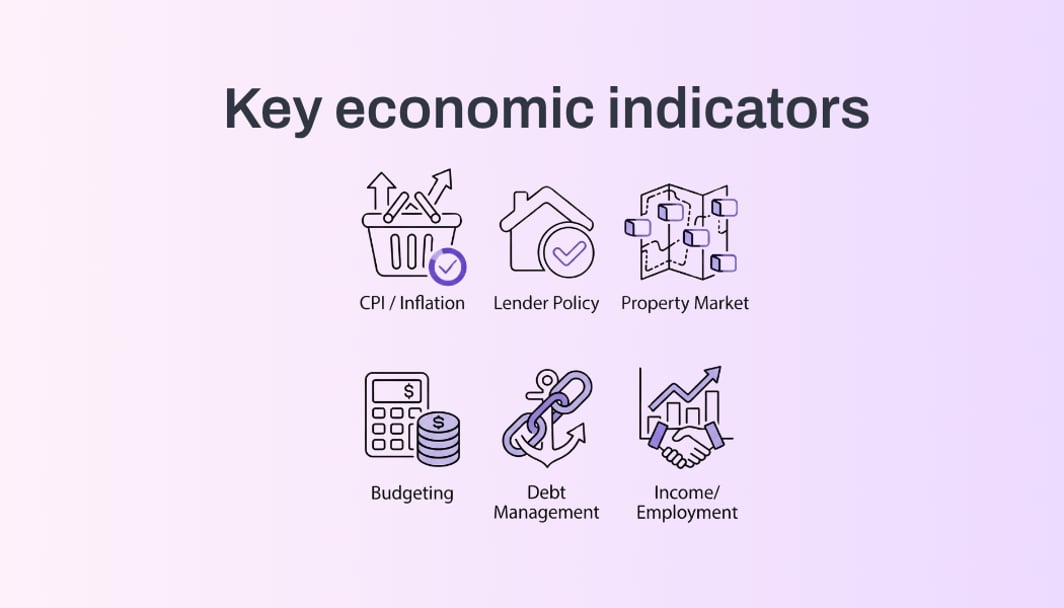
The RBA sets the cash rate based on six key indicators: CPI inflation, core inflation, unemployment, GDP growth, home prices, and wage growth. These metrics most directly signal the likely direction for rates. The Board also weighs global conditions, household debt, and financial stability, but the six core measures drive most decisions.
Economic Highlights
- Headline inflation down to 3.7%, still above the RBA's 2-3% band
- Unemployment up from 4.1% to 4.3%, suggesting a softer labour market
- GDP growth up to 0.8%, while wages and house prices keep rising
Inflation (CPI)
Consumer Price Index measuring changes in the cost of living. Both headline and core (trimmed mean) inflation are measured monthly, comparing to the same month last year.
Headline Inflation (YoY)
6 Months Ago
Core Inflation - Trimmed Mean (YoY)
6 Months Ago
Headline Inflation Trend (Monthly)
Core Inflation Trend (Monthly)
💡Expert Insights
Key Takeaway
The monthly pace has settled down, but the yearly rate is still too high for the RBA’s comfort.
What's Happening
Headline inflation is at 3.7% in February 2026, down a touch from 3.8% in January and December, and up from 3.4% in November. It was 3.0% a year ago and 3.8% six months ago. Monthly inflation was flat in February after a 0.4% rise in January, so price pressure has cooled a bit lately.
Impact on Borrowing
At 3.7%, inflation is still above the RBA’s 2-3% target, so that can keep rate cuts off the table for now and leave borrowing costs higher for longer.
Unemployment Rate
The share of people in the workforce who want a job but do not have one.
Current Value
Quarterly Change
fell to a lower level
Same Time Last Year
March 2025
12-Month Trend
💡Expert Insights
Key Takeaway
Unemployment has edged up from 4.1% to 4.3%, so the labour market is softer than it was, but not sharply weak.
What's Happening
The unemployment rate is at 4.3% in March 2026, up from 4.1% in January and sitting at the same level as February. It is also higher than 4.1% a year ago and six months ago.
Impact on Borrowing
A higher unemployment rate can give the RBA more room to keep rates steady or cut them if jobs weaken and inflation stays near its 2-3% target. It can ease pressure on borrowing costs.
GDP Growth
GDP growth measures how much Australia’s economy is growing or shrinking, including spending, business activity and government spending, compared with a year earlier.
Current Value
Quarterly Change
Growth rate for this period
Same Time Last Year
2024-Q4
12-Month Trend
💡Expert Insights
Key Takeaway
Australia’s economy is still growing, but at a slow pace. The jump from 0.4% a year ago to 0.8% now is better, yet it is still not strong growth.
What's Happening
Latest annual GDP growth is 0.8% in 2025-Q4, up from 0.5% in 2025-Q3 and 0.4% a year ago. It was also 0.8% six months ago, so growth has lifted, but only modestly.
Impact on Borrowing
Growth at 0.8% is weak and sits well below the RBA’s 2-3% inflation target range. That usually keeps pressure on the RBA to stay cautious about rate rises, and can support lower borrowing costs over time if inflation is also easing.
Home Prices
The average price of houses across Australia, based on ABS data.
Current Value
Quarterly Change
rose by 2.7%
Same Time Last Year
2024-Q4
12-Month Trend
💡Expert Insights
Key Takeaway
House prices are climbing steadily, and the gap to a year ago is still sizeable - up $113, or about 11.7%.
What's Happening
Mean house prices rose to $1,075 in 2025-Q4, up from $1,046 in the previous quarter and $1,030 six months ago. That is also higher than $962 a year ago.
Impact on Borrowing
Rising house prices can add to inflation pressure, which may keep the RBA more cautious on rate cuts. Higher prices also make borrowing and repayments harder for buyers.
Wage Growth
Wage growth shows how fast Australian pay is rising over time, compared with the same time last year.
Current Value
Quarterly Change
rose to a higher level
Same Time Last Year
2024-Q4
12-Month Trend
💡Expert Insights
Key Takeaway
Pay growth has levelled off around 3.4% after easing from last year’s stronger pace, so wage pressure is cooler but not back to the RBA’s comfort zone.
What's Happening
Wages rose 3.4% in 2025-Q4, up from 3.3% in 2025-Q3 and the same as 2025-Q2 and 2025-Q1. It is down from 4.0% a year ago.
Impact on Borrowing
At 3.4%, wage growth is still above the RBA’s 2-3% inflation target range, so it can keep pressure on rates and borrowing costs.
Ready to act on these insights?
Use our tools and talk to experts to understand how these economic conditions affect your home loan
Explore More About the RBA Cash Rate
Frequently Asked Questions
The RBA primarily uses six indicators: CPI inflation, core inflation (trimmed mean), unemployment rate, GDP growth, home prices, and wage growth.